| Price Charts, Technical and Fundamental Analysis / Technical Indicators / Oscillators / Stochastic Oscillator |
|
|
Stochastic Oscillator
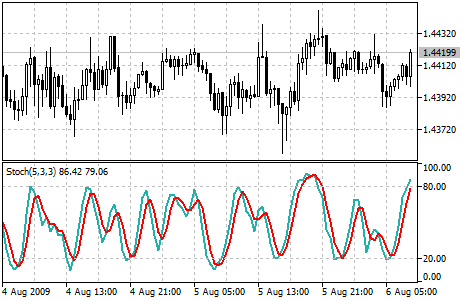
The Stochastic Oscillator Technical Indicator compares where a security’s price closed relative to its price range over a given time period. The Stochastic Oscillator is displayed as two lines. The main line is called %K. The second line, called %D, is a Moving Average of %K. The %K line is usually displayed as a solid line and the %D line is usually displayed as a dotted line. There are several ways to interpret a Stochastic Oscillator. Three popular methods include:
You can test the trade signals of this indicator by creating an Expert Advisor in MQL5 Wizard. |
|---|

Calculation
Four variables are used for the calculation of the Stochastic Oscillator:
The formula for %K is:
%K = (CLOSE - MIN (LOW (%K))) / (MAX (HIGH (%K)) - MIN (LOW (%K))) * 100
Where:
CLOSE — today’s closing price;
MIN (LOW (%K)) — the lowest minimum in %K periods;
MAX (HIGH (%K)) — the highest maximum in %K periods.
The %D moving average is calculated according to the formula:
%D = SMA (%K, N)
Where:
N — smoothing period;
SMA — Simple Moving Average.